Sometimes you need to see detail of your BR*TOOLS operations , in that case you can create and activate TRACE files like below..
- On Operation System Level
If you going to use BR*TOOLS on OS Level then you can use “-TRC <TRACE LEVEL>” option at the end of the command for “Command Prompt” usage.
Or you can set the related Environment Variable like shown below on “Operating System” level also…
C:\set BR_TRACE=<TRACE LEVEL>
After that you can use the related BR*TOOL you want.
- ON SAP Level
If you going to use BR*TOOL on SAP DB13 transaction code then you have to configure following steps
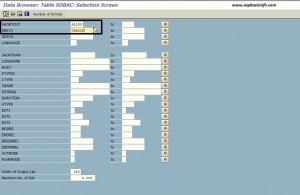
Go to SE16 –> SDBAC
Insert the following data and EXECUTE
SHORTCUT = ALLOG
DBSYS = ORACLE
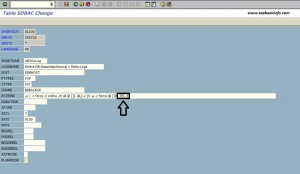
Select the related line and press the CHANGE (F6) button.
Find the line PSTRING
Add the TRACE LEVEL you want at the end of the line
SAVE and exit the transaction
Trace levels
- Trace level 1
External programs Trace
- Trace level 2
SQL statements Trace
- Trace level 4
Internal functions Trace
- Trace level 8
Environment information Trace
Please note that , you can use it like ;
Trace Level 10 (2 + 8)





I’m not that much of a internet reader to be honest but your blogs really nice,
keep it up! I’ll go ahead and bookmark your site to come
back in the future. All the best from ukrain..