If you want to administrate and monitor your SAP HANA databases , you can use the “SAP HANA Cockpit” tool.SAP HANA cockpit, a web-based HTML5 user interface that you access through a browser, runs on SAP HANA extended application services, advanced model.
You can open the HANA cockpit via “Web Browser” or “SAP HANA Studio”
To open the “SAP HANA Cockpit” via “SAP HANA Studio” you can use the following steps ;
SAP HANA Studio –> Right Click on the System in Navigation Pane –> Configuration and Monitoring –> Open SAP HANA Cockpit
To open the “SAP HANA Cockpit” via “Web Browser” you can use the following links ;
Single-container system
http://<host_FQDN>:<port>/sap/hana/admin/cockpit
System DB of multi-container system
http://<host_FQDN>:<port>/sap/hana/admin/cockpit
Tenant DB in multi-container system
http://<tenant_DB_FQDN>:<port>/sap/hana/admin/cockpit
For our case, we are using http(s) connection with port TCP-4300
https://<servername>:4300/sap/hana/admin/cockpit
You will get the login screen like below ;
Use the SYSTEM user with password to logon to the system
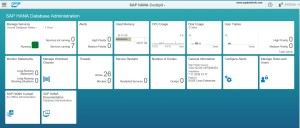
You will be able to see following cockpit screen like below picture
You can use all these features easily with this cockpit.
For an example you can check the “Services” , also you can “Stop” or “Start” services via the page.
This is the page you can find detail informations of your HANA system, you can go to this area with just clicking the “General Information” area on the cockpit home page.
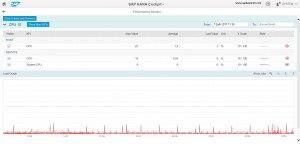
Also another useful screen to check your HANA systems performance, to open this page click the “CPU Usage” area.
You can use all following features via SAP HANA Cockpit…
Manage Services
Alerts
Used Memory
CPU Usage
Disk Usage
User Tables
Monitor Statements
Manage Workload Classes
Threads
Service Restarts
Number of Dumps
General Information
Configure Alrets
Manage Roles and Users
SAP HANA Cockpit
SAP HANA Documentations


